Attention
This documentation is under active development, meaning that it can change over time as we refine it. Please email help@massive.org.au if you require assistance, or have suggestions to improve this documentation.
Frequently Asked Questions About GPUs on M3#
How long will I wait for a GPU?#
The queue time for GPU resources will vary depending on what you have asked for, what is in demand, and your groups historical usage. If you have submitted a job to the SLURM scheduler, and you want an estimated start time, try this command:
squeue --start -u [username]
If you have only just submitted the job and/or it says N/A, the job scheduler has yet to estimate your wait time (find room for your job). Check again later, and if the N/A persists for more than 4 hours, send us an email and we can investigate further: help@massive.org.au. If you think youre waiting too long for a GPU, we suggest checking Why am I waiting so long for a GPU? before emailing us as you may be able to solve the issue independently.
If you would like to learn about more commands for monitoring your job status, please look at Checking Job Status.
Why am I waiting so long for a GPU?#
A HPC is a shared computing resource, and the SLURM scheduling system tries to make resource access fair across users. Here are some common reasons the scheduler may struggle to allocate you resources.
Reason you’re waiting |
Why does this impact my wait time? |
How can I improve my wait time? |
|---|---|---|
Either you or your project submit a high volume of jobs (compared to other users within your institutional share). |
The SLURM scheduler responds to high usage by reducing your priority, ensuring other users have fair access to compute resources. |
You can improve your job start times by organising plans for job submission and usage within your project group. Submit the smallest resource request that completes your job (Walltime, RAM). |
|
The bigger the request the harder it is for the scheduler to find a suitable place in the cluster to run your job. Rare and/or larger combinations of hardware are harder to schedule. |
Profile your job - if you need less GPUs, time, CPUs, or other resources, adjust your job to make it less challenging to schedule. We can help profile your job, contact us at help@massive.org.au. |
You are asking for something impossible: “sbatch: error: Batch job submission failed: Requested node configurations is not available.” |
For example, you requested more memory, more CPUs or more GPUs than installed on our equipment or an expired reservation. |
Check the job start time using squeue and if it is indefinite, review your request. |
Your job will run into a scheduled down time. |
Example: the scheduler cannot run a 24 hour job if the system is scheduled to go down in 23 hours. |
Check your email for cluster notifications from MASSIVE. |
Using show_job might also help you diagnose any issues you’re having, as described here in Diagnosing Problems with Jobs.
If you feel your job is taking forever (>24hrs) and you would like us to investigate why or help you fix this, send us an email at help@massive.org.au.
How do I know if my job is using the GPU?#
If you’re running a desktop or an interactive job, you can monitor the resources your job is using on the command line with the NVIDIA System Management Interface.
watch nvidia-smi
This will output a dashboard for monitoring your usage in real-time.
Every 2.0s: nvidia-smi

Wed Apr  7 13:51:57 2021
+-----------------------------------------------------------------------------+
| NVIDIA-SMI 460.32.03    Driver Version: 460.32.03    CUDA Version: 11.2     |
|-------------------------------+----------------------+----------------------+
| GPU  Name        Persistence-M| Bus-Id        Disp.A | Volatile Uncorr. ECC |
| Fan  Temp  Perf  Pwr:Usage/Cap|         Memory-Usage | GPU-Util  Compute M. |
|                               |                      |               MIG M. |
|===============================+======================+======================|
|   0  Tesla P4            On   | 00000000:00:0D.0 Off |                    0 |
| N/A   36C    P8     6W /  75W |     15MiB /  7611MiB |      0%      Default |
|                               |                      |                  N/A |
+-------------------------------+----------------------+----------------------+

+-----------------------------------------------------------------------------+
| Processes:                                                                  |
|  GPU   GI   CI        PID   Type   Process name                  GPU Memory |
|        ID   ID                                                   Usage      |
|=============================================================================|
|    0   N/A  N/A      2374  G   X                                  15MiB |
+-----------------------------------------------------------------------------+
This output is full of useful information. Below there is an image provided of the nvidia-smi output of a desktop session, numbered 1-5.
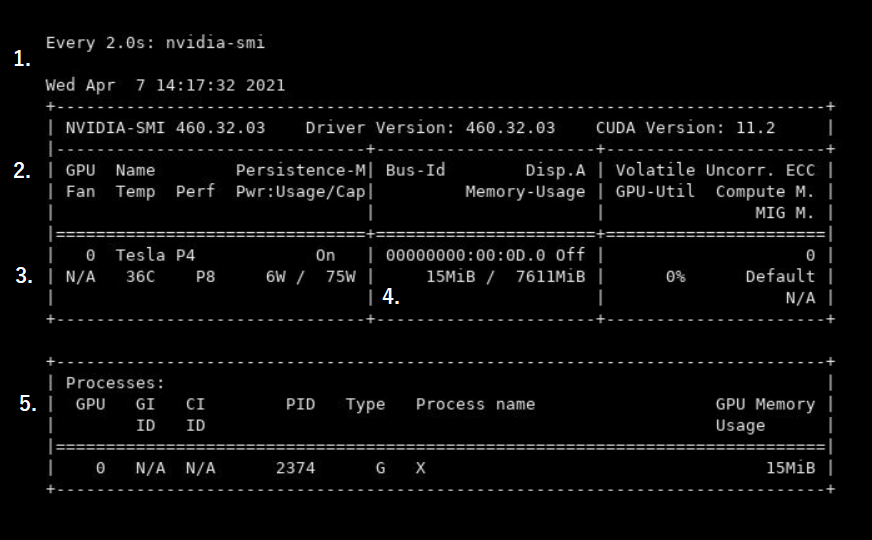
Tells you how often the output of nvidia-smi is being updated, and when the last update occured. In the above image, nvidia-smi updates every 2 seconds, with the most recent update on the 7th of April at 14:17:32, 2021.
Provides the labels for the information below in the section numbered 3.
In this example, we see GPU:0, which means we are using our first GPU. If there are multiple GPUs available they will be numbered accordingly. We can see the GPU name is a Tesla P4, and Temp is 36C. You can also see information about the power usage, both in watts (6W in this example), and power rating, “P8”. This rating ranges from P0 to P12, where P0 is maximum power usage and P12 is power saving mode.
This section of output tells you how much memory is being used.
This section lists any processes you’re running, such as Python scripts, which GPU is running the process and how much memory it is using.
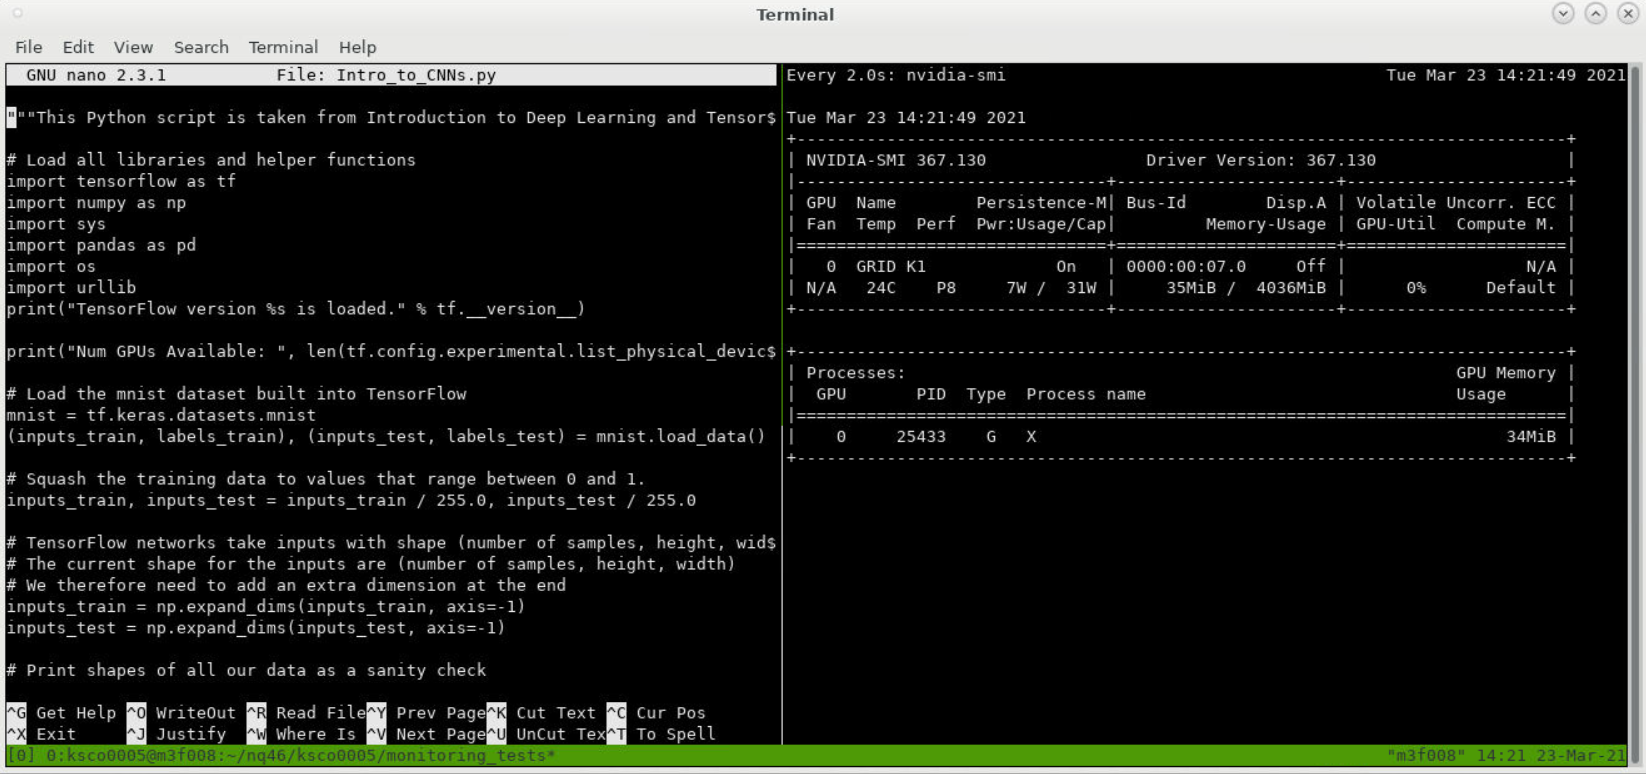
One convenient way to view your job usage with nvidia-smi is to use tmux to split your command line interface, keeping your watch nvidia-smi command running in one pane, with your work in another, side by side. You can do this by running:
tmux new-session
Which will open a tmux session. Once you’re in this session, you should be able to press Ctrl+b, followed by %, to split your terminal vertically. Change panes by pressing Ctrl+b, followed by the arrow keys to indicate which pane you intend to move into. Find more information about tmux at the tmux read the docs page.
If you’re running an sbatch job, nvidia-smi won’t monitor what your submitted job is doing. We have written scripts to monitor GPU usage on Python jobs in this Github repository. You can adapt the instructions for submitted jobs by following them, and then running the job monitoring script within your job submission file. If you require any help to do this, please reach out as this documentation is still being updated.
I’m in the Machine Learning Community, do you have any specific advice for me?#
We have provided examples of machine learning code that uses the GPUs on M3 in the ML4AU GitHub repository, including example job submission scripts and advice for moving from Desktops to job submission.
The Machine Learning page in our documentation also includes some tips and tricks for using GPUs for ML on M3.
We have also benchmarked the GPUs on M3 using a tool called AI-Benchmark, which runs 42 different Machine Learning (ML) tasks to generate a training, inference, and an overall “ML” score. The higher the number, the better the GPU performed. These benchmarks show the A40 GPUs are the best GPUs on M3 for Machine Learning workflows, followed closely by the V100 GPUs. Note that these benchmarks are indicative of single-GPU performance only, and we highly recommend that you also perform benchmarks using your own workflows to determine which GPU types and configurations are best suited to your work.
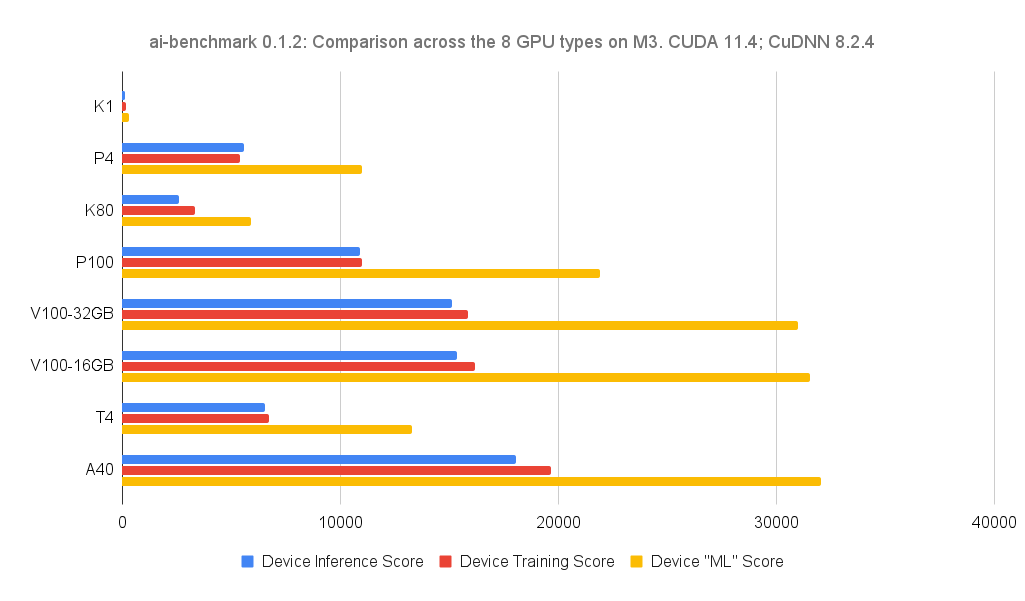
To learn more about how we conducted these benchmarks and to run them yourself, see this blog post on the ML4AU website, and the ML4AU Github repository.